


Chapter 4. Monitoring system components
The SAN384B is engineered for reliability and requires no routine operational steps
or maintenance. This chapter provides information about determining the status of
the following components using LEDs and CLI commands. Refer to the Fabric OS
Administrator's Guide and the Web Tools Administrator's Guide for more information
on monitoring component status.
v “Port or application blade status”
v “Control processor blade (CP8) status” on page 53
v “Core switch blade (CR4S-8) status” on page 55
v “Power supply status” on page 56
v “Blower assembly status” on page 57
v “WWN card status” on page 59
Port or application blade status
To determine the status of a port or routing blade:
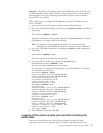
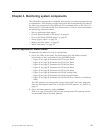
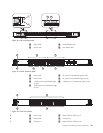
1. Check the LEDs on the blade. The illustrations show the blades oriented
horizontally, as they are installed in the SAN384B chassis.
v Figure 18 on page 46 illustrates the FC8-16 port blade
v Figure 19 on page 46 illustrates the FC8-32 port blade
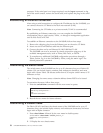
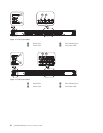
v Figure 20 on page 47 illustrates the FC8-48 port blade
v Figure 21 on page 47 illustrates the FC8-64 port blade
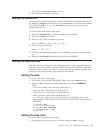
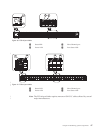
v Figure 22 on page 48 illustrates the FC10-6 port blade
v Figure 23 on page 49 illustrates the FR4-18i routing blade
v Figure 24 on page 49 illustrates the FX8-24 extension blade
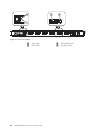
v Figure 25 on page 49 illustrates the FCOE10-24 Fibre Channel over Ethernet
blade
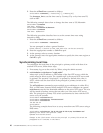
The LED patterns may temporarily change during POST and other diagnostic
tests. For information about how to interpret the LED patterns, see Table 9 on
page 51.
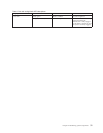
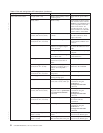
2. Check the blade status by typing slotShow.
Table 9 on page 51 describes the port and routing blade LED patterns and the
recommended actions for those patterns.
© Copyright IBM Corp. 2009, 2010 45
|