


Switch Explorer View
49Web Tools Version 3.1.x/4.1.x User Guide
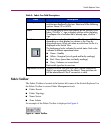
Fabric Toolbar
The Fabric Toolbar is located at the bottom left corner of the Switch Explorer. Use
the Fabric Toolbar to access Fabric Management tools:
■ Fabric Events
■ Fabric Topology
■ Name Server
■ Zone Admin
An example of the Fabric Toolbar is displayed in Figure 8.
Figure 8: Fabric Toolbar
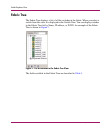
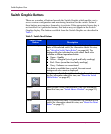
Table 5: Fabric Tree Field Descriptions
Field Description
View by: Select the
View by
drop-down menu to change the way
switches are displayed in the tree. Select one of the following
options: Name, IP, or WWN.
Fabric This is a navigation menu that displays all the switches in the
fabric. Click the “+” sign to display switches within the fabric.
To collapse a list of switches that is already open, click the “-”
sign.
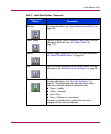
Switch Icon The switches can be listed by Name, IP address, or WWN
depending on what display you choose in the
View by
drop-down menu. When you select a switch from this list it is
displayed in the Switch View.
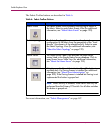
The background color indicates the switch status. Each color
indicates a different operational state:
■ Green - Healthy
■ Yellow - Marginal (mix of good and faulty readings)
■ Red - Down (more than two faulty readings)
■ Gray - Unknown or unmonitored
Each switch type has its own icon.
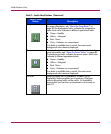
Segmented Switches Displays switches that have lost Fibre Channel connectivity
(that is, are segmented from the fabric). These switches can
still be administered if the IP connection is valid.