


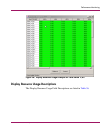


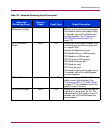


Performance Monitoring
167Web Tools Version 3.1.x/4.1.x User Guide
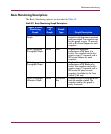
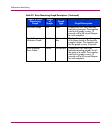
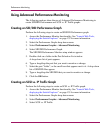
Using Basic Performance Monitoring
The Basic Performance Monitoring are described in the following sections.
Creating a Port Throughput Graph
Perform the following steps to create a Port Throughput graph.
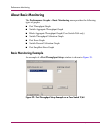
1. Access the Performance Monitor functionality. See “Launch Web Tools,
displaying the Switch Explorer.” on page 153 for more information.
2. Select the Performance Graphs drop-down menu.
3. Select Performance Graphs > Basic Monitoring.
4. Select the Port Throughput Graph.
The Port Throughput setup window is displayed.
5. Double-click on a switch folder to see available ports.
6. Type or click and drag the selected port number from the Port Selection list to
the Enter/Drag Port window.
7. Click the Ok button.
Creating a Snapshot of Port Errors
Create a snapshot of port error by performing the following procedure.
1. Access the Performance Monitor functionality. See “Launch Web Tools,
displaying the Switch Explorer.” on page 153 for more information.
2. Select the Performance Graphs drop-down menu.
3. Select Performance Graphs > Basic Monitoring.
4. Select Port Snapshot Errors.
The Port Snapshot errors graph is displayed on the canvas.
5. Select Actions > Save Current Canvas Configuration to save the graphs on
the canvas.