


Performance Monitoring
161Web Tools Version 3.1.x/4.1.x User Guide
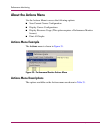
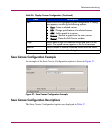
Using the Actions Menu
The following sections describe the operations supported by the Actions Menu.
Adding a Graph to a Canvas
1. Access the Performance Monitor functionality. See “Launch Web Tools,
displaying the Switch Explorer.” on page 153 for more information.
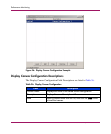
2. Select Actions > Display Canvas Configurations.
The Canvas Configuration List appears (see the example: “Creating an
SID/DID Performance Graph” on page 170 if a graph has not yet been
created).
3. Highlight the desired graph in the list.
4. Click the Load Button.
The graph appears on the main canvas.
5. Repeat steps 3 and 4 for each graph you want to add to the canvas.
You can add up to 8 graphs to a canvas.
Changing an Existing Graph
1. Access the Performance Monitor functionality. See “Launch Web Tools,
displaying the Switch Explorer.” on page 153 for more information.
2. Select Actions > Display Canvas Configurations.
The Canvas Configuration List appears (see the example: “Creating a Port
Throughput Graph” on page 167 if a graph has not yet been created).
3. Select the desired graph from the list.
4. Click the Edit button.
The Edit Graph dialog box appears.
5. Click the Edit button.
6. Make necessary changes.
7. Click the OK button.