


Performance Monitoring
166 Web Tools Version 3.1.x/4.1.x User Guide
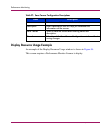
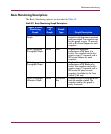
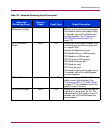
Port Error Graph Port Line Displays the CRC error rate over
time for a given port. The snapshot
rate for this graph is every 15
seconds with a 60 minute lifespan
for each snapshot.
Switch Percent
Utilization Graph
Switch Horizontal
Bar
Displays the percentage of usage
of a chosen switch at the time the
sample is taken. The snapshot rate
for this graph is every 5 seconds.
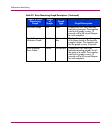
Ports SnapShot
Error Graph
Switch Vertical Bar Displays the CRC error rate
between sampling periods for all
the ports on a switch. The snapshot
rate for this graph is every 15
seconds with a 60 minute lifespan
for each snapshot.
Table 39: Basic Monitoring Graph Descriptions (Continued)
Name of Basic
Monitoring
Graph
Scope
of
Graph
Graph
Type
Graph Description