


Performance Monitoring
151Web Tools Version 3.1.x/4.1.x User Guide
■ An existing report can be selected from a list of reports that are predefined. In
some cases, you can supply the object to be monitored and graphed (such as
port number, SID/DID pair, AL_PA, or switch domain number).
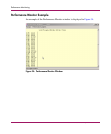
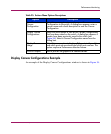
■ Graphs are displayed on a canvas, which can hold a maximum of eight graphs
simultaneously. An individual graph can be maximized to occupy the entire
canvas. The size of the graphs on the canvas is determined by the number of
graphs being displayed. The window does not need to be scrolled to view all
the selected graphs.
■ The collection of graphs in the canvas can be stored for later retrieval on the
switch. Up to 20 individual canvases can be saved. Each canvas is saved with
its name, a brief description, and up to 8 graphs which comprise the canvas.
■ Any graph can Zoom In, or be magnified and detached from the main canvas
or Removed from the main canvas using a pop-up menu. The pop-up menu is
displayed by pointing the mouse at any graph on the main canvas and clicking
the right mouse button. To re-attach the (Zoomed Out) detached graph back to
the main canvas, you can point the mouse to the detached graph, click the
right button and select Zoom Out.
■ Each graph can be printed to a printer of choice.
For more information about the Performance Monitor, see the HP StorageWorks
Advanced Performance Monitoring Version 3.1.x/4.1.x User Guide.