


Performance Monitoring
165Web Tools Version 3.1.x/4.1.x User Guide
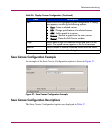
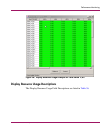
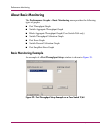
Basic Monitoring Descriptions
The Basic Monitoring options are described in Table 39.
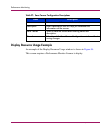
Table 39: Basic Monitoring Graph Descriptions
Name of Basic
Monitoring
Graph
Scope
of
Graph
Graph
Type
Graph Description
Port Throughput
Graph
Port Line Displays the performance of a port
based on four-byte frames received
and transmitted. The snapshot rate
for this graph is every 15 seconds
with a 60 minute lifespan for each
snapshot.
Switch Aggregate
Throughput Graph
Switch Line Displays the aggregate
performance of all ports of a
switch. The snapshot rate for this
graph is every 15 seconds with a
60 minute lifespan for each
snapshot.
Blade Aggregate
Throughput Graph
Switch Line Displays the aggregate
performance of all blades of a
switch. The snapshot rate for this
graph is every 15 seconds with a
60 minute life span for each
snapshot. Available for the Core
Switch 2/64 only.
Switch Throughput
Utilization Graph
Switch Horizontal
Bar
Displays the port throughput at the
time the sample is taken. The
snapshot rate for this graph is
every 5 seconds.