


Auto LUN XP user guide for the XP12000/XP10000 59
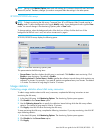
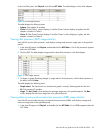
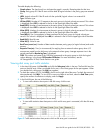
The table displays the following:
• Graph column: The check mark icon indicates the graph is currently illustrating data for that item.
• Group: Parity group ID. If the ID starts with the letter E, logical volumes in the parity group are external
LUs.
• LDEV: Logical volume ID. If the ID ends with the symbol #, logical volume is an external LU.
• Type: Emulation type.
• IO Rate (IOPS): Number of I/O requests to the parity group (or logical volume) per second. This column
is displayed when IOPS is selected in the list on the upper-right side of the table.
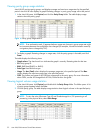
• Read (IOPS): Number of read accesses to the parity group (or logical volume) per second. This column
is displayed when IOPS is selected in the list on the upper-right side of the table.
• Write (IOPS): Number of write accesses to the parity group (or logical volume) per second. This column
is displayed when IOPS is selected in the list on the upper-right side of the table.
• Trans.(MB/s): Size (in megabytes) of data transferred to the parity group (or logical volume) per
second. This column is displayed when MB/s is selected in the list on the upper-right side of the table.
• Read Hit(%): Read hit rate.
• Write Hit(%): Write hit rate.
• Back Trans.(count/sec): Number of data transfers between parity group (or logical volume) and cache
memory.
• Response Time (ms): Time (in microseconds) for replying from an external volume group when I/O
accesses are made from the disk array to the external volume group. Average response time in the
period specified for Monitoring Term is displayed.
• CLPR: The number and name of the CLPR that corresponds to the parity group to which the logical
volume belongs, in the format CLPR number:CLPRname. For more information, see the
HP StorageWorks XP Disk/Cache Partition user guide.
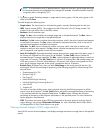
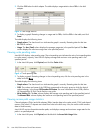
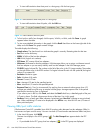
Viewing disk array port traffic statistics
1. In the Auto LUN pane, click Port-LUN, and click the Subsystem folder in the tree. The Port-LUN tree lists
ports on the disk array. When you double-click a port, a list of host groups for the port appears. When
you double-click a host group, the LUN icon appears.
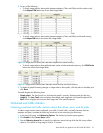
2. To check the number of I/Os, click IOPS in the list on the right side of the pane. To check the amount of
data transferred, click MB/s. To view IOPS or amount of data in real time, select the Real Time option,
specify the number of collections to display, and click Apply.
3. In the Port-LUN tree, do one of the following:
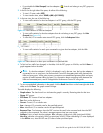
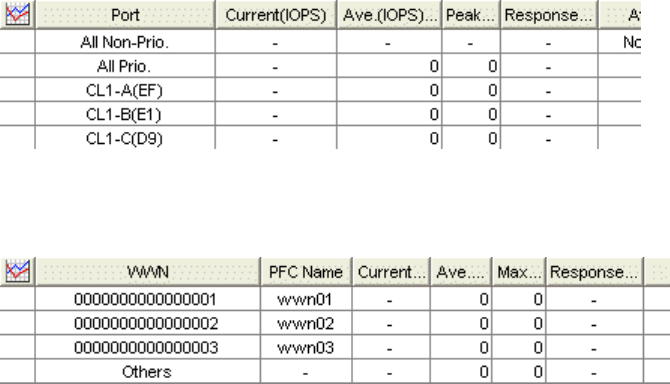
• To view traffic statistics about ports in the disk array, click the root.
Figure 30 Traffic statistics about ports in a disk array
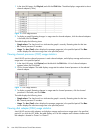
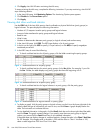
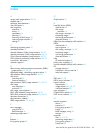
• To view traffic statistics about host ports to which a disk array port is connected, click the disk array
port.
Figure 31 Traffic statistics about host ports to which a disk array port is connected