


52 Auto LUN/Performance Control Base Monitor
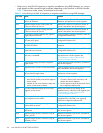
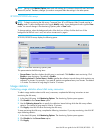
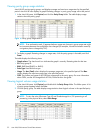
Viewing parity group usage statistics
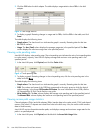
Auto LUN XP monitors parity groups, and displays average and maximum usage rates for the specified
period. Auto LUN XP also displays a graph illustrating changes in parity group usage within that period.
1. In the Auto LUN pane, click Physical, and click the Parity Group folder. The table displays usage
statistics about the parity group.
Figure 16 Parity group usage statistics
NOTE: If an exclamation mark (!) appears before a usage rate, that parity group usage rate might
be inaccurate because the configuration has changed (for example, volumes have been moved by
a migration plan or changed by VSC).
2. To display a graph illustrating changes in usage rates, click the parity groups in the table, and click
Draw.
The table displays the following items:
• Graph column: The check mark icon indicates the graph is currently illustrating data for that item.
• PG: Parity group ID.
• RAID: RAID level (RAID-5 or RAID-1).
• Drive Type: Hard disk drive type.
• Usage: The Ave. (Total) column displays the average usage rate in the specified period. The Max.
column displays the maximum usage rate in the specified period.
• CLPR: The number and name of the CLPR that corresponds to the parity group. For more information
about CLPRs, see the HP StorageWorks XP Disk/Cache Partition user guide.
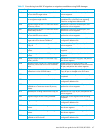
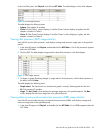
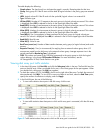
Viewing logical volume usage statistics
1. In the Auto LUN pane, click Physical, and double-click the Parity Group folder. The folder opens. A list
of parity groups appears below the folder.
2. Click the parity group. The table displays usage statistics about logical volumes in the specified parity
group.
NOTE: To view the ratio of Business Copy XP and ShadowImage for z/OS processing to all
processing in the physical drive, select Short Range.
Figure 17 Logical volume usage statistics