


58 Auto LUN/Performance Control Base Monitor
4. Click Apply. Auto LUN XP starts monitoring the disk array.
To stop monitoring the disk array, complete the following instructions. If you stop monitoring, Auto LUN XP
stops collecting statistics.
1. In the Auto LUN pane, click Monitoring Options. The Monitoring Options pane appears.
2. Click Disable for the Current Status option.
3. Click Apply.
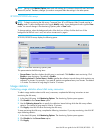
Viewing disk drive workload statistics
Use the LDEV tab of the Auto LUN pane to check workloads on physical disk drives (parity groups) or
logical volumes. The pane displays the following information:
• Number of I/O requests issued to parity groups and logical volumes
• Amount of data transferred to parity groups and logical volumes
• Read hit rate
• Write hit rate
• Number of data transfers between parity groups (or logical volumes) and cache memory
1. In the Auto LUN pane, click LDEV. The LDEV tree displays a list of parity groups.
2. In the list on the right, click IOPS to specify I/Os per second, or click MB/s to specify megabytes
transferred per second.
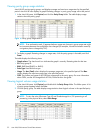
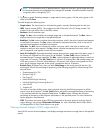
3. In the LDEV tree, do one of the following:
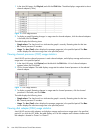
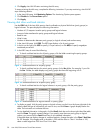
• To check workload statistics for all parity groups, click the folder containing the parity groups.
Figure 27 Workload statistics for all parity groups
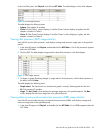
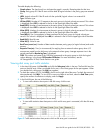
• To check workload statistics for certain parity groups, click a Box folder. For example, if you click
the Box 1 folder, the table displays only parity groups that have IDs beginning with 1-.
Figure 28 Workload statistics for a specific parity group
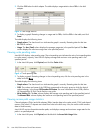
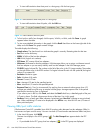
• To check workload statistics for logical volumes in a parity group, click the parity group.
Figure 29 Workload statistics for logical volumes in a parity group
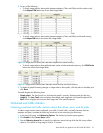
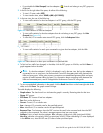
4. To display a graph, click the parity groups or logical volumes, use the list on the lower-right side of the
table to select the type of information you want to view, and click Draw. A graph displays below the
table. The horizontal axis indicates the time.
5. To view detailed information in the graph, click the Detail check box on the lower-right side of the table,
and click Draw. The graph contents change. If you specify more than one parity group or logical
volume, you cannot click the Detail check box to view detailed information.
If the graph does not display changes in workload statistics, change the value in the Chart Y Axis Rate
list. For example, if the largest value in the table is 200 and the value in Chart Y Axis Rate is 100,
select a value larger than 200 from Chart Y Axis Rate.