


Auto LUN XP user guide for the XP12000/XP10000 25
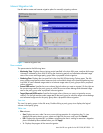
Monitoring term section
Use this section to specify the monitoring period. This setting affects all Auto LUN XP monitoring panes.
Use the From box and slide bar to specify the starting date for the monitoring period. Use the To box and
slide bar to specify the ending date for the monitoring period.
Click Real Time to display workload statistics in real time. Use the list to specify the data range to be
displayed in the graph. This check box appears dimmed when the Physical or LDEV tab is active. If the
service processor is overloaded, extra time might be required for gathering monitoring results, and a
portion of the results will not be displayed.
The Apply button applies the monitoring period settings to the disk array.
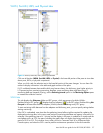
Monitoring data section
This section includes the following:
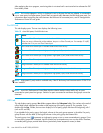
• A list on the left to specify the units in which usage are displayed (MB/s, IOPS, and so forth).
• The CAXJ Monitor pane displays information about Continuous Access XP Journal’s continuous access
operation. This information is also displayed in the Usage Monitor pane. For more information, see the
HP StorageWorks Continuous Access XP Journal user guide.
• The URz Monitor pane displays information about the Universal Replicator for z/OS’s continuous
access operation. This information is also displayed in the Usage Monitor pane. For more information,
see the Hitachi True Copy for z/OS for the XP128/XP1024/XP10000/XP1200.
NOTE: If any continuous access function is not installed in your environment, the corresponding
tab for that function is inactive and you cannot display that pane.
• A list on the right to specify the type of monitoring required: long range or short range. Long range
monitoring is available only when the Physical tab is active.
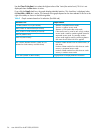
Table section
This section displays the following:
• Statistics about traffic between host bus adapters (HBAs) in the hosts and ports on the disk array, if the
WWN tab is active.
• Traffic statistics about WWNs and ports if the Port-LUN tab is active.
• Workload statistics about logical volumes if the LDEV tab is active.
• Statistics about parity group usage, processor usage, and so forth if the Physical tab is active.
• The Plan button is displayed when the Physical tab is active. Clicking this button displays Plan pane
containing the Manual Migration, Auto Migration, Attribute, and History tabs.
• The Draw button draws a graph in the pane’s graph section. The graph charts the statistics displayed in
the table section.
• The PFC button is displayed when the WWN or Port tab is active. Clicking this button displays the
Performance Control pane. For details, see HP StorageWorks Performance Control XP user guide.
• The Current Control status is displayed when the WWN or Port tab is active. It displays the status of
Performance Control:
• Port Control: System performance is controlled by the upper limits and threshold specified in the Port
tab of the Performance Control pane
• WWN Control: System performance is controlled by the upper limits and threshold specified in the
WWN tab of the Performance Control pane
• No Control: System performance is not controlled by Performance Control
For further information, see HP StorageWorks Performance Control XP user guide.
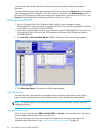
Graph section
The graph shows statistics displayed in the table. The vertical axis shows usage values. The horizontal axis
shows date or time.