


15
change from “sunny” directly to “clouds with rain”
although it is possible for the change to occur quickly. If
the symbols do not change then the weather has not
changed or the change has been slow and gradual. If this
happens on a regular basis, it may be necessary to adjust
the weather forecast sensitivity.
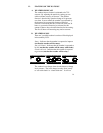
C. WEATHER TENDENCY ARROWS
Another icon in the tendency LCD is weather tendency
arrows, one that points up and one that points down.
These arrows reflect current changes in the air pressure:
an arrow pointing up indicates that the air pressure is
increasing and the weather is expected improve or remain
good. An arrow pointing down indicates that the air
pressure is decreasing and the weather is expected to
become worse or remain poor. No arrow means the
pressure is stable.
A storm can be expected if there is a drop of 4 hPa or
more in less than 6 hours, the rain icon is displayed and
the downward pointing arrow is flashing. The flashing
will stop when the air pressure stabilizes or begins to rise.
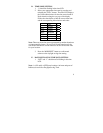
D. AIR PRESSURE HISTORY BAR GRAPH
The bar graph shows in hPa the recorded air pressure over
the past 72 hours. The horizontal axis shows the hours at
the increments of 72h, 48h, 36h, 24h, 18h, 12h, 9h, 6h,
3h, 1h, and 0h (0h is the current hPa). The vertical axis is
set by hPa: 0 is the current hPa and + or – or –2,4,6 or 8
shows (in hPa) how high or low past air pressure was as
compared to the current one. If the bars are rising (higher
on the right side of the graph than the left) then the air
pressure has a rising trend, and the weather should
improve. If the bars are dropping (lower on the right of