


P a g e | 22
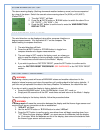
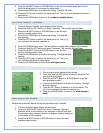
The vertical bars are plotted at each of the seven steps and give the trend over the recorded
period. The 0 hour vertical bar will always display at the midline height to indicate the current air
pressure. The varying height of bars in other columns on the graph indicates a relative change
in air pressure up or down from the 0 hour.
New pressure measurements are compared to previously recorded pressure measurements.
The pressure change is expressed by the difference between the current ("0h") and the past
readings in divisions of ±0.06 inHg or ±2 hPa. If the bars are rising from left to right, this
indicates that the weather is getting better due to an increase in air pressure. If the bars are
falling from left to right, this indicates that the weather is expected to get worse due to a drop in
air pressure.
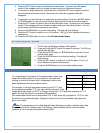
At every full hour, the current air pressure is used as a basis for the display of a new graph bar.
The existing graph is then moved one column to the left.
Note: For accurate barometric pressure trend, the Weather Center should operate at the
same altitude. Should the unit be moved, for instance from the ground to the second floor of the
house, the readings for the next 48-60 hours shall be discarded.
Note: The bar graph will scroll right to left regularly to prevent LCD burnout.
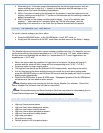
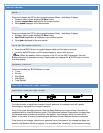
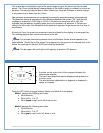
WIND DIRECTION AND WIND SPEED MEASUREMENT
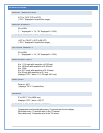
A pointer on the outer circle of the compass indicates the
current wind direction.
The last 6 wind directions may be displayed with pointers on
the inner circle.
The wind direction (abbreviation or degrees) is displayed in
center of compass.
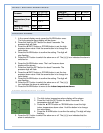
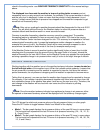
Press the SET button to toggle between Mode1 and Mode 2 of the display.
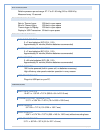
Mode 1 displays the following wind data:
Wind direction
Wind chill in F or C
Wind speed in mph, km/h, bft, knots or m/s
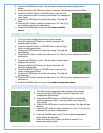
Mode 2 displays the following wind data:
Wind direction
Wind chill in F or C
Wind gust in mph, km/h, bft, knots or m/s