


56 Auto LUN/Performance Control Base Monitor
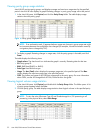
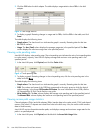
2. Click the DRR below the disk adapter. The table displays usage statistics about DRRs in the disk
adapter.
Figure 22 DRR usage statistics
3. To display a graph illustrating changes in usage rate for DRRs, click the DRRs in the table, and click
Draw.
The table displays the following items:
• Graph column: The check mark icon indicates the graph is currently illustrating data for that item.
• ID: DDR ID numbers.
• Usage: The Ave. (Total) column displays the average usage rate in the specified period. The Max.
column displays the maximum usage rate in the specified period.
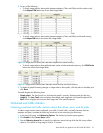
Viewing write pending rates
Auto LUN XP displays write pending rates. The write pending rate indicates the ratio of write-pending data
to cache memory capacity. Auto LUN XP displays average and maximum write pending rates in the
specified period.
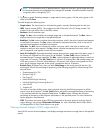
1. In the Auto LUN pane, click Physical, and click the Cache folder.
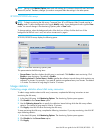
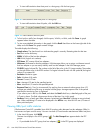
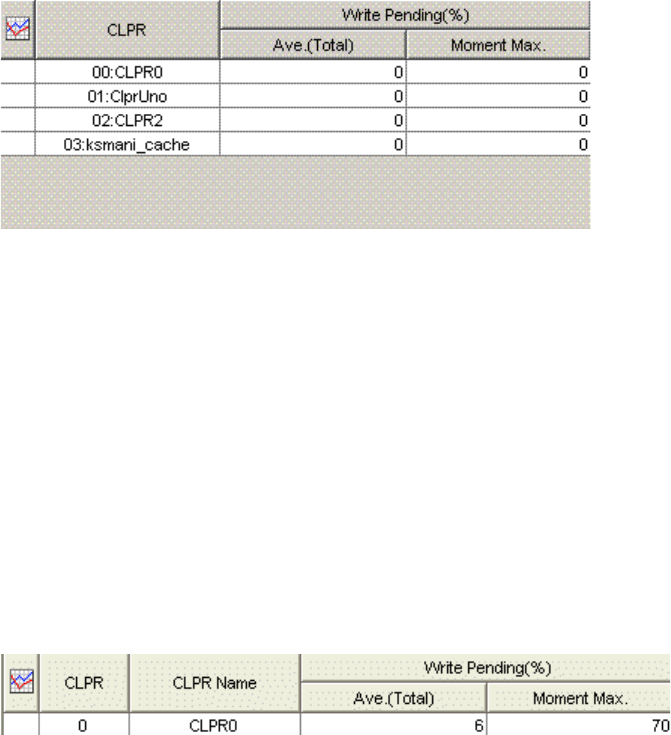
Figure 23 Write pending rates
2. To display a graph illustrating changes in the write pending rate, click the write pending rate in the
table, and click Draw.
The table displays the following items:
• Graph column: The check mark icon indicates the graph is currently illustrating data for that item.
• CLPR: The number and name of the CLPR that corresponds to the parity group to which the logical
volume belongs, in the format CLPR number:CLPR name. For more information about CLPRs, see the
HP StorageWorks XP Disk/Cache Partition user guide.
• Write Pending (%): The Ave. column displays the average write pending rate for the specified period.
The Moment Max. column displays the maximum write pending rate for the specified period.
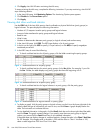
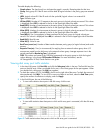
Viewing access path usage statistics
Channel adapters (CHAs) and disk adapters (DKAs) transfer data to the cache switch (CSW) and shared
memory (SM) when I/O requests are issued from hosts to the disk array. Also, the cache switch transfers
data to cache memory.
Auto LUN XP monitors these data transfer paths, and displays average and maximum usage rates for the
paths in a specified period.
1. In the Auto LUN pane, click Physical, and double-click the Access Path Usage folder.