


88
thereafter again increases to beyond +77°F, the data will be blinking, but
no alarm will be activated. It has to drop to below +75.2°F (with a pre-set
hysteresis of 1.8°F) so that the alarm can be produced again. Hysteresis
values for the various weather data types are given in the following table:
Weather data Hysteresis
Temperature 1.8°F
Humidity 3% RH
Wind speed 3.1 mph
Note:
The temperature or humidity data will keep on flashing even after a key has
been pressed to stop the alarm or buzzer has been switched off, to indicate
that the current weather condition is out of the pre-set limit(s)
WEATHER FORECAST AND WEATHER TENDENCY
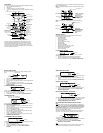
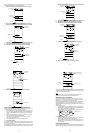
WEATHER FORECASTING ICONS:
Weather forecasting icons are displayed in any of the following
combinations at the right bottom part of LCD:
For every sudden or significant change in the air pressure, the weather
icons will update accordingly to represent the change in weather.
(Every time a new average pressure value has been obtained (once per
minute), this value is compared with an internal reference value. If the
difference between these values is bigger than the selected weather
tendency sensitivity, the weather-icon changes, either for worse or for
better. In this case, the current pressure value becomes the new weather
tendency reference.)
If the icons do not change, either the air pressure has not changed or the
change has been too small for the Weather Center to register. So you may
adjust the "sensitivity" of the pressure change checking in the setting
mode –see WEATHER TENDENCY SENSITIVITY VALUE SETTING
above.
However, if the icon displayed is a sun or raining cloud, there will be no
change of icon if the weather gets any better (with sunny icon) or worse
(with rainy icon) since the icons are already at their extremes.
The icons displayed forecasts the weather in terms of getting better or
worse and not necessarily sunny or rainy as each icon indicates. For
example, if the current weather is cloudy and the rainy icon is displayed, it
does not mean that the product is faulty because it is not raining. It simply
means that the air pressure has dropped and the weather is expected to
get worse but not necessarily rainy.
Note:
After setting up, readings for weather forecasts should be disregarded for
the next 48-60 hours. This will allow sufficient time for the Weather station
to collect air pressure data at a constant altitude and therefore result in a
more accurate forecast.
Common to weather forecasting, absolute accuracy cannot be guaranteed.
The weather forecasting feature is estimated to have an accuracy level of
Sunny
TENDENCY
Cloudy with sunny
intervals
TENDENCY
Rainy
TENDENCY
89
about 75% due to the varying areas the Weather Center has been
designed for use. In areas that experience sudden changes in weather (for
example from sunny to rain), the Weather Center will be more accurate
compared to use in areas where the weather is stagnant most of the time
(for example mostly sunny).
If the Weather Center is moved to another location significantly higher or
lower than its initial standing point (for example from the ground floor to the
upper floors of a house), discard the weather forecast for the next 48-60
hours, as the Weather Center may mistake the new location as being a
possible change in air-pressure when really it is due to the slight change of
altitude.
WEATHER TENDENCY INDICATOR
Working together with the weather icons is the weather tendency indicators
(arrow located on the left and right sides of the weather icons). When the
indicator points upwards, it means that the air-pressure is increasing and
the weather is expected to improve, but when indicator points downwards,
the air-pressure is dropping and the weather is expected to become worse.
Taking this into account, one can see how the weather has changed and is
expected to change. For example, if the indicator is pointing downwards
together with cloud and sun icons, then the last noticeable change in the
weather was when it was sunny (the sun icon only). Therefore, the next
change in the weather will be cloud with rain icons since the indicator is
pointing downwards.
Note:
Once the weather tendency indicator has registered a change in air
pressure, it will remain permanently visualized on the LCD.
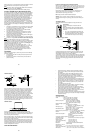
AIR PRESSURE HISTORY (ELECTRONIC BAROMETER WITH
BAROMETRIC PRESSURE TREND)
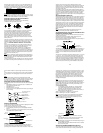
The bottom section of the LCD also shows the relative air pressure value
and the air pressure history.
Depending on programming conditions, display of the history of air
pressure in form of a graph consisting of vertical bars.
The bar graph of the electronic barometer shows the air pressure history of
the past 12 hours in five 3-hour steps.
The horizontal axis represents the last 12 hours air pressure recording (-12,
-9, -6, -3 and 0 hour). The bars are plotted at each of the 5 steps and give
the trend over the recorded period. The scale on the right compares the
result. The "0" in the middle of this scale determines the current air
pressure.
The vertical axis represents the air pressure changes in inHg (+0.12, +0.06,
0, -0.06, -0.12. The “0” represents the current air pressure). The newly
measured pressure was compared to the previously recorded pressure
reading. The pressure change is expressed by the difference between the
current ("0h") and the past readings in division of ±2 hPa or ±0.06 inHg. If
the bars are rising it indicates that the weather is getting better due to an
increase in air pressure. If the bars go down it indicates a drop of the air
Air pressure
changes in inHg
Air pressure
changes in hPa
90
pressure and the weather is expected to get worse from the present time
"0".
At every full hour, the current air pressure is used as a basis for the display
of a new graph bar. The existing graph is then moved one column to the
left.
Note:
For accurate barometric pressure trend, the Weather Center should
operate at the same altitude. For example, it should not be moved. Should
the unit be moved, for instance from the ground to the second floor of the
house, the readings for the next 48-60 hours shall be discarded.
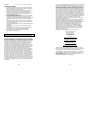
WIND DIRECTION AND WIND SPEED MEASUREMENT
In normal display mode, the second section of the LCD shows the following
wind data.
• Wind direction (shown on the a compass scale of 16 divisions) and
wind speed/ gust in Beaufort scale
• Wind chill in °F or °C
• Wind Speed in km/h, mph or m/s
• Gust in km/h, mph or m/s (displayed when in Mode 2, by pressing the
SET key shortly)
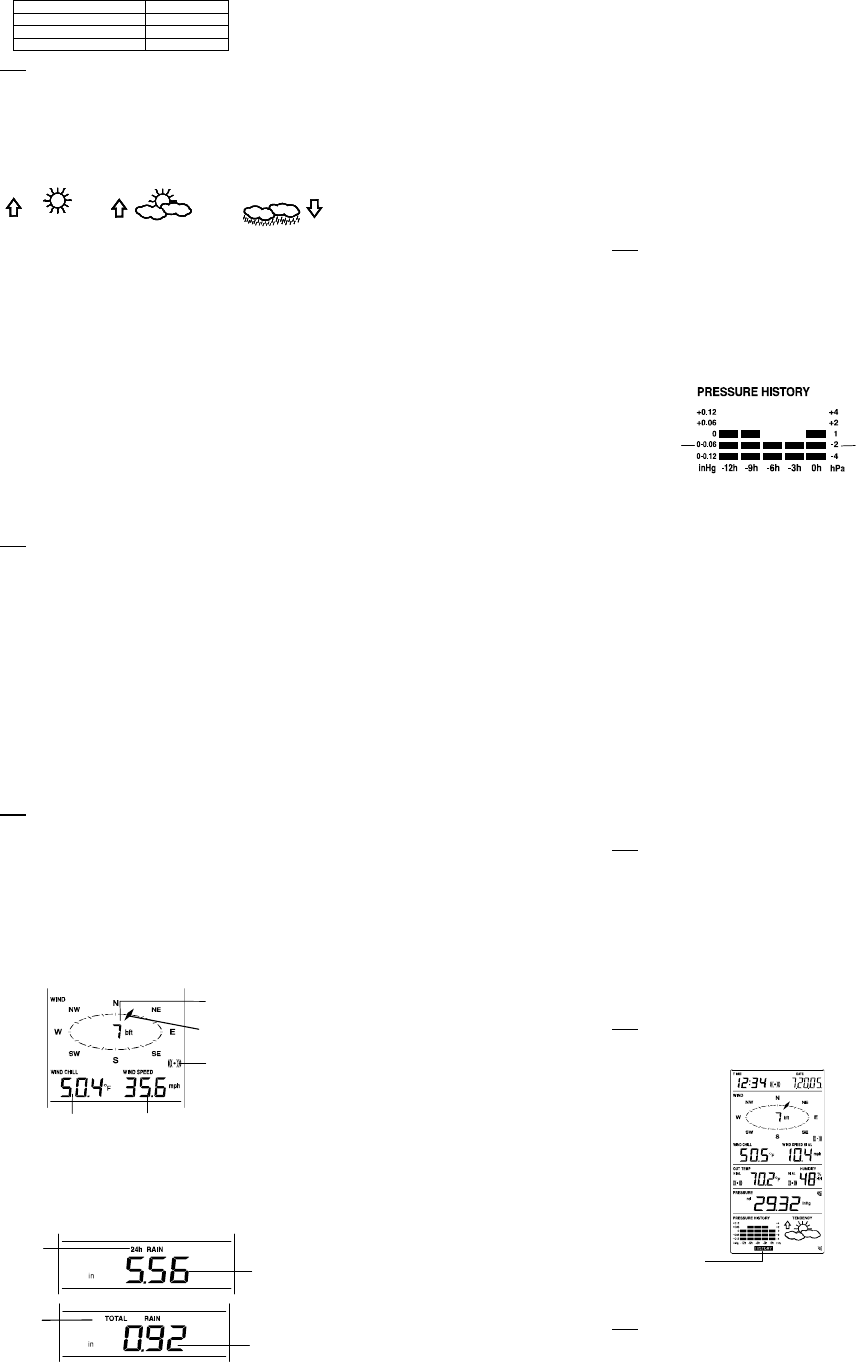
RAINFALL MEASUREMENT
The total rainfall and 24 hour rainfall measurement is displayed in the fourth
section of the LCD, in the unit of mm or inch.
To View the 24-hour rainfall or the Total rainfall reading:
1. In normal display, press SET key once and the display will shift to
Mode 2.
2. Press + key consecutively key to toggle between the 24-hour rainfall,
Total rainfall and Rel. pressure reading.
VIEWING THE HISTORY DATA
The weather station can store up to 140 sets of weather data which are
recorded automatically at 3-hour intervals after the weather station is
powered up, at the nearest time of 0:00, 03:00, 06:00, 09:00, 12:00, 15:00,
24 hour
rainfall icon
Total rainfall
icon
24 hour rainfall
amount
Total rainfall amount
Pointer indicates the
currently detected wind
direction
Text showing wind speed
in Beaufort scale
Wind speed or gust will be show
This alarm symbol
indicates that the alarm
is set On
Wind chill
91
18:00 and 21:00. For instance, if user has manually set the time as 14:52
after installing batteries, the first history record will be made at the coming
15:00 automatically. Then the second record will be on 18:00 and so on.
Each weather record includes the Wind direction, Wind speed/ gust in
Beaufort scale, Wind chill temperature, wind speed/gust, dew point,
Outdoor temp and humidity, relative pressure, 24-hour rainfall and total
rainfall, pressure history and weather tendency. Also, the time and date of
recording will be displayed.
Note:
In order to acquire the correct time of recording of the history records, you
shall manually set the current time as soon as installing batteries to the
weather station. Afterwards, you should avoid changing the pre-set time as
it will also alter the recorded "time of recording" of each history record,
which may lead to confusion.
To view the weather history:
1. In normal display, press the HISTORY key. The latest weather
record will be shown with the date and time of recording. The
"HISTORY" icon will be displayed at the bottom of the LCD.
2. When viewing History records, user may shift to see the Mode 1 or
Mode 2 data by pressing the SET key.
(Mode 1: with wind speed + outdoor Temp + Rel. pressure;
Mode 2 : with wind gust + Dew point + rainfall data)
Note: If user wants to choose to view total rainfall or 24-hour rainfall in
history records, he shall first in normal display choose to show the
particular rainfall data, the press History key and SET key to view the
particular rainfall data in History records.
3. When viewing History records, press MIN/ MAX to view older
records.
(Press MIN/MAX and + key to view "Previous" and "Next" record
respectively. The records are made at 3-hour intervals)
Note:
• The stored history records will not be retained after battery change or
whenever battery is removed.
• The total rainfall value will be exhibited in whole number (no decimal
place) in the history record.
VIEWING THE MAXIMUM/ MINIMUM WEATHER DATA
The weather station will record the maximum and minimum value of the
various weather data with time and date of recording automatically. The
HISTORY icon