


35
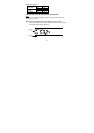
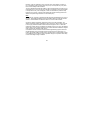
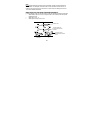
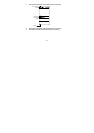
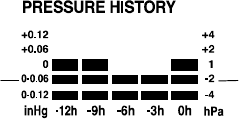
The horizontal axis represents the last 12 hours air pressure recording (-12, -9, -6, -3
and 0 hour). The bars are plotted at each of the 5 steps and give the trend over the
recorded period. The scale on the right compares the result. The "0" in the middle of
this scale determines the current air pressure.
The vertical axis represents the air pressure changes in inHg (+0.12, +0.06, 0, -0.06, -
0.12. The “0” represents the current air pressure). The newly measured pressure was
compared to the previously recorded pressure reading. The pressure change
is expressed by the difference between the current ("0h") and the past readings in
division of ±2 hPa or ±0.06 inHg. If the bars are rising it indicates that the weather is
getting better due to an increase in air pressure. If the bars go down it indicates a
drop of the air pressure and the weather is expected to get worse from the present
time "0".
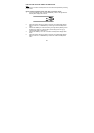
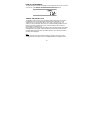
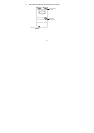
At every full hour the current air pressure is used as a basis for the display of a new
graph bar. The existing graph is then moved one column to the left.
Air pressure
changes in inHg
Air pressure
changes in hPa