


Performance Monitoring
168 Web Tools Version 3.1.x/4.1.x User Guide
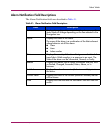
About Advanced Monitoring (Optional)
The Advanced Monitoring menu provides the following graphs:
■ SID/DID Performance Graph
■ SCSI Commands Graph
■ SCSI vs. IP Graph
■ AL_PA Error Graph
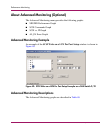
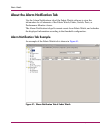
Advanced Monitoring Example
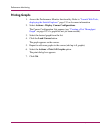
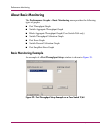
An example of the SCSI Write on a LUN Per Port Setup window is shown in
Figure 40.
Figure 40: SCSI Write on a LUN Per Port Setup Example on a SAN Switch 2/32
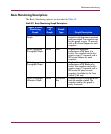
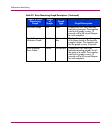
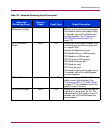
Advanced Monitoring Descriptions
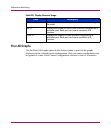
The Advanced Monitoring graphs are described in Table 40.